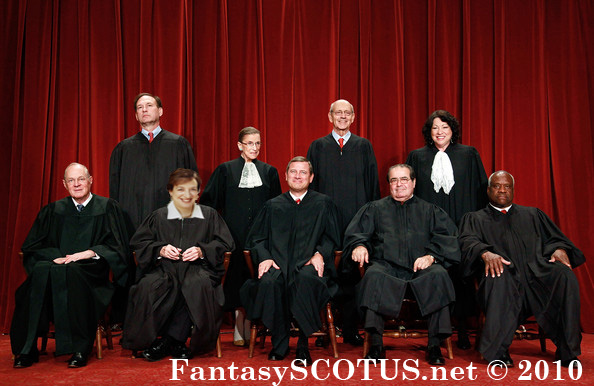
Who will replace Justice John Paul Stevens? While pundits, savants, and oracles across the SCOTUSphere pontificate and read Article III tea leaves, FantasySCOTUS.net conducted extensive and detailed polling to predict the next Justice. We have invited our nearly 5,000 members–who represent some of the closest and most ardent Court watchers–to weigh in on the vacancy, rank the candidates on the short list, and give their views on the potential nominees. We are still collecting data. Sign up for free at www.fantasyscotus.net and voice your opinion. This is the fourth in a series of posts breaking down this data, as we attempt to add some certainty to the vast amounts of uncertainty emanating from the penumbras of the upcoming vacancy.
As the Supreme Court has closed off the front doors at One First Street, it is time for us to close the page on speculation of who will take John Paul Stevens’ seat on the highest court. In this post, we will be comparing the numbers from our initial post on April 15 with our most recent data. Over the past month, we have received more votes, and our sample size has increased by almost 30%.
And the data shows, Elena Kagan FTW!!

In this post, we will be comparing the initial numbers for each candidate in the areas of favorability (on a scale of -10 to 10), and the percentage which they were picked as the top nominee, followed by their current favorability and top nominee percentages, and the favorability and top picks for the votes added since April 15.
| Nominee | Rating on 4/15 | Initial Top Pick % on 4/15 | Current Rating | Current Top Pick % | Votes After 4/15 Rating | Votes After 4/15 Top Pick % |
| Kagan | 2.99 | 54% (81) | 3.17 | 53% (110) | 3.65 | 51% (28) |
| Wood | 3.04 | 21% (32) | 3.06 | 22% (45) | 3.13 | 25% (14) |
| Garland | 1.84 | 10% (15) | 1.97 | 8% (17) | 2.33 | 4% (2) |
| Sunstein | 1.91 | 4% (6) | 2.06 | 5% (10) | 2.47 | 7% (4) |
| Clinton | -0.03 | 4% (6) | 0.08 | 3% (6) | 0.33 | 0 |
| Sullivan | 1.68 | 3% (5) | 1.76 | 2% (5) | 1.98 | 0 |
| Patrick | 0.64 | 2% (3) | 0.86 | 3% (7) | 1.47 | 7% (4) |
| Napolitano | 0.51 | 1% (2) | 0.79 | 2% (4) | 1.56 | 4% (2) |
Interestingly, many users changed their votes. Why did their votes change? And do we yield a different results? These bench marks are important to see whether or not the media frenzy in the intervening period has a substantial effect on the predictions. The results, after the jump at JoshBlackman.com.
Looking at the chart, little has changed with the pick percentages since the start of April. Kagan still leads as the top pick with over 50% of the vote, followed by Wood with over 20%, and finally Garland with around 9%.
The predictions made since April 15 maintained Kagan’s lead, but also directed more support towards Wood. However, none of the changes are statistically significant, which shows that media support and articles of individual candidates do little to change who is perceived to be the top pick for the nomination. Although our poll does not include other “potential” nominees such as Jennifer Granholm or Sid Thomas, the lack of significant difference in the nominee’s pick percentages indicates that “revelations” of other possible candidates have had little impact.
The one thing that did change is the favorability ratings for all of the candidates. Each potential nominee in our slate saw a positive gain in favorability. Generally speaking, the recent votes were much more favorable to the candidates, with Kagan being .66 more favorable among the newer predictions than she was in our initial predictions.
Even Clinton and Sullivan, who picked up no votes among the newcomers, received higher ratings than they had in the initial votes. More importantly, the additional predictions resolved an issue noted in our first article that Wood was slightly more favorable than Kagan. Due to her .66 gain in favorability among the new predictions, Kagan was able to overtake Wood by .11 in terms of favorability, while Wood only gained .09 among new predictions. While media had no measurable effect on who the top pick was, it does seem that the media might have an effect on how users rated the candidates on favorability. And Kagan became much more popular over time.
Overall, it seems that the contest for nominees is pretty static in terms of public opinion, and an early lead on that front creates a substantial advantage for a potential nominee. The media, in their efforts to find the story in the nomination, does not really do that much to change who the top pick is, but does seem to make the public more comfortable with the potential nominees as time goes on.
Although this effect won’t suddenly make Hillary Clinton a crowd favorite, or Kagan reviled by all, the media’s efforts and investigations do seem to blunt the edge of criticism against most of the potential nominees. Of course, this could also be somewhat of a sigh of relief as others such as Granholm attempt to jump in the spotlight, and make the slate of possible nominees look like a better choice. Although the actual pick rests with the President, the numbers once again show that Kagan is the Once and Future Nominee.
In short, Elena Kagan FTW!
This article was co-authored by Josh Blackman and Corey Carpenter.