 In 2009, I created FantasySCOTUS. What started off as a joke, and began as a hastily-put-together website, has grown beyond my wildest imagination. Now, we have over 20,000 players who make predictions about how the Justices will decide cases. In an article I co-authored in 2011, we found that our prediction market was strikingly accurate, with the power predictors hitting a 75% accuracy rate in a given year.
Today, I am proud to announce the next evolution in Supreme Court prediction. Rather than relying on human predictions, my colleagues and I have developed an algorithm that can predict any case decided by the Supreme Court, since 1953, using only information available at the time of the cert grant.
In a new article, my co-authors Daniel Martin Katz, Michael J. Bommarito II, and I have designed a general approach to predicting the behavior of the Supreme Court of the United States. Using only data available prior to the date of decision, our model correctly identifies 69.7% of the Court’s overall affirm and reverse decisions and correctly forecasts 70.9% of the votes of individual justices across 7,700 cases and more than 68,000 justice votes.
While other models have achieved comparable accuracy rates, they were only designed to work at a single point in time with a single set of nine justices. Our model has proven consistently accurate at predicting six decades of behavior of thirty Justices appointed by thirteen Presidents. It works for the Roberts Court as well as it does for the Rehnquist, Burger, and Warren Courts. It works for Scalia, Thomas, and Alito as well as it does for Douglas, Brennan, and Marshall. Plus, we can predict Harlan, Powell, O’Connor, and Kennedy.
69.7% Accuracy for Case Outcomes
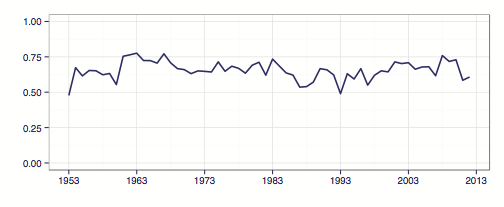
We begin making forward prediction starting with the first case of the Warren Court in 1953, through the end of the 2012-2013 term. For each of the predictions, offered over 60 years–7,700 cases and in excess of 68,000 individual justice votes–we only rely on data that would have been available prior to the Court’s decision. In effect, we generated a new round of predictions every day of every Supreme Court term since 1953. With this data, through a method of machine-learning known as “extremely randomized trees,” and a process known as feature-engineering, we were able to build a model that can generate Justice-by-Justice predictions for any case. Applying the extremely randomized trees approach to each case from 1953-2013, our model correctly forecasts 69.7% of Case Outcomes and 70.9% of Justice Level Vote Outcomes over the sixty year period.
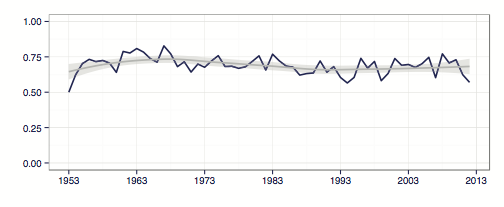
This graph illustrates our accuracy rate over the past six decades. Although our accurate rate fluctuates year-to-year–as low as 60% and as high as 80%–the best fit line hovers right around 71%. We tended to be a bit more accurate during the Warren and Burger courts than during the Rehnquist and Roberts Courts.Recent courts have had much more variability.
70.9% Accuracy for Justice Predictions
Overall, we have a 70.9% accuracy rate for justice predictions. Some justices were harder to predict than others. To illustrate the “predictability” of a Justice, we generated a heat map. On this map, we’ve plotted each Justice who has served on the Court, and for each year added a shaded box. The more green the cell, the more predictable the Justice in that year. Our method performs well at predicting certain Justices and not as well on others.
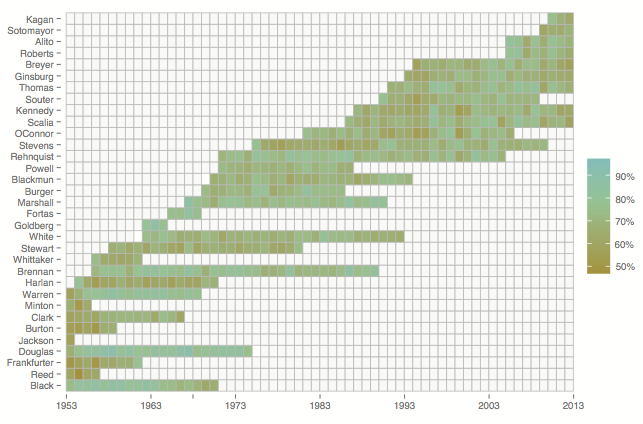
For example, Justices Harlan, Frankfurter, and Burton prove comparatively difficult to predict. All of these Justices are closer to the ideological center. By contrast, our method is fairly accurate at predicting the behavior of Justices Douglas, Brennan, and Thomas. These justices are quite far from the ideological center. There are, of course, notable exceptions. Justice Stevens begins as a difficult to predict justice but over time becomes increasingly easier to predict. In his years as an Associate Justice our performance in predicting William Rehnquist is relatively strong. This changes almost immediately following his elevation to Chief Justice in 1986 when our performance begins to decline. Our model learns, and can track a Justice’s shifting throughout his or her tenure from appointment till retirement.
Predicting Affirmances and Reversals
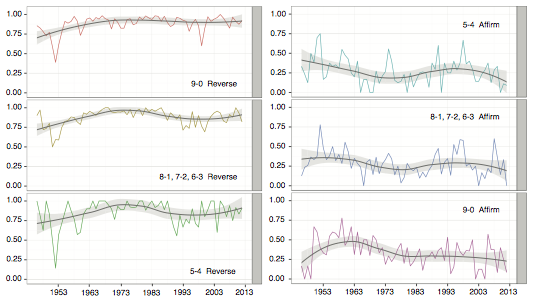
We are also able to break down our accuracy based on the vote configurations. Our model tracks the commonplace intuition that 9-0 reversals are easier to forecast than 5-4 reversals. While our performance between these categories is somewhat close in certain years, we consistently perform better in unanimous reversal cases than in cases which feature disagreement between justices. We also perform better on cases with a vote of 9-0 to affirm than in cases that affirm through a divided court.
 Our model struggles to identify in advance cases that the Court ultimately decides to affirm–especially unanimous affirmances. Since 1953, the Court has affirmed 2,623 cases or 34.1% of its fully argued cases. On this subset of cases, our model does not perform particularly well. In some years, we are able to forecast less than 25% of these cases correctly. This graph represents the overall reverse rate.
Machine Learning Model – Extremely Randomized Trees
So how does our algorithm work? Our model generates many randomized decision trees that try to predict the outcome of the cases, with different variables receiving different weights. This is known as the “extremely randomized trees” method. Then, the model compares the predictions of the trees to what actually happened, and learns what works, and what doesn’t. This process is repeated process many, many times, to calculate the weights that should be afforded to different variables. In the end, the model creates a general model to predict all cases across all courts. You can download all of our source code here.
This general model is represented by this graph, which lists the 90+ variables we consider for each case, and their relevant weights.
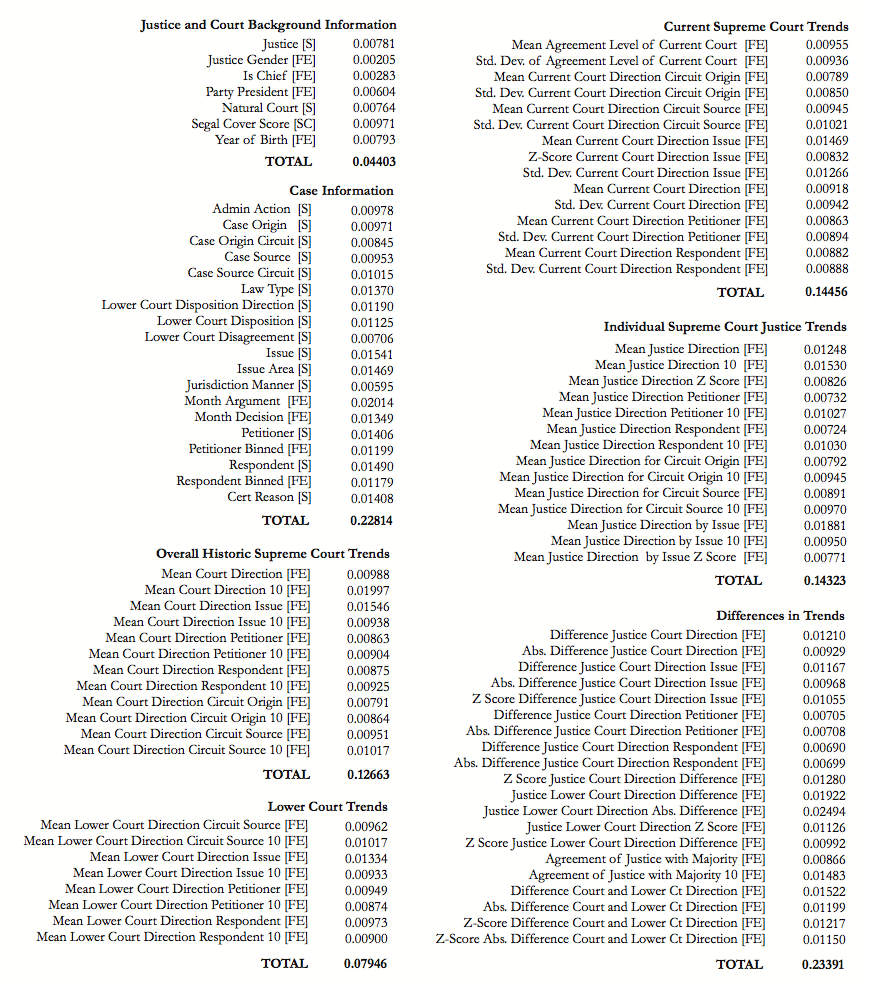
Collectively, individual case features account for approximately 23% of predictive power while Justice and Court level background information account for just 4.4%. Much of the predictive power of our model is driven by tracking a variety of behavioral trends. This includes tracking the ideological direction of overall voting trends as well as the voting behavior of various justices. Differences in these trends prove particular useful for prediction. These include general and issue specific differences between individual justices and the balance of the Court as well as ideological differences between the Supreme Court and lower courts. Contrary to what many may think, it’s not all about ideology. The identity of the petitioner, respondent, what the cause of action is, what Circuit the case arises from, and other case-specific features are very significant.
The Tournament
So what’s next? I’m sure you’re wondering how our model will do with future cases decided in the upcoming term. That’s the plan.
This year we will be hosting a tournament where the players of FantasySCOTUS will compete against our algorithm. What IBM’s Watson did on Jeopardy, our model aims to do for the Supreme Court. Stay tuned for more details.